pathoSPOT
Available Datasets
The following datasets were detected in your
data/
directory. Click the links below to open the heatmap for each dataset.
See the instructions below on how to run the pathoSPOT pipeline to produce a new analyzed dataset.
Pathogen Sequencing
Phylogenomic Outbreak Toolkit
pathoSPOT is an open-source bioinformatics pipeline that turns pathogen genome sequences sampled from patients into interactive visualizations of probable transmission scenarios.
Try it now
Click the images to explore visualizations of methicillin-resistant Staphylococcus aureus collected over 24 months within the Mount Sinai Health System (full article at Genome Medicine).
Dates have been shifted during data anonymization.
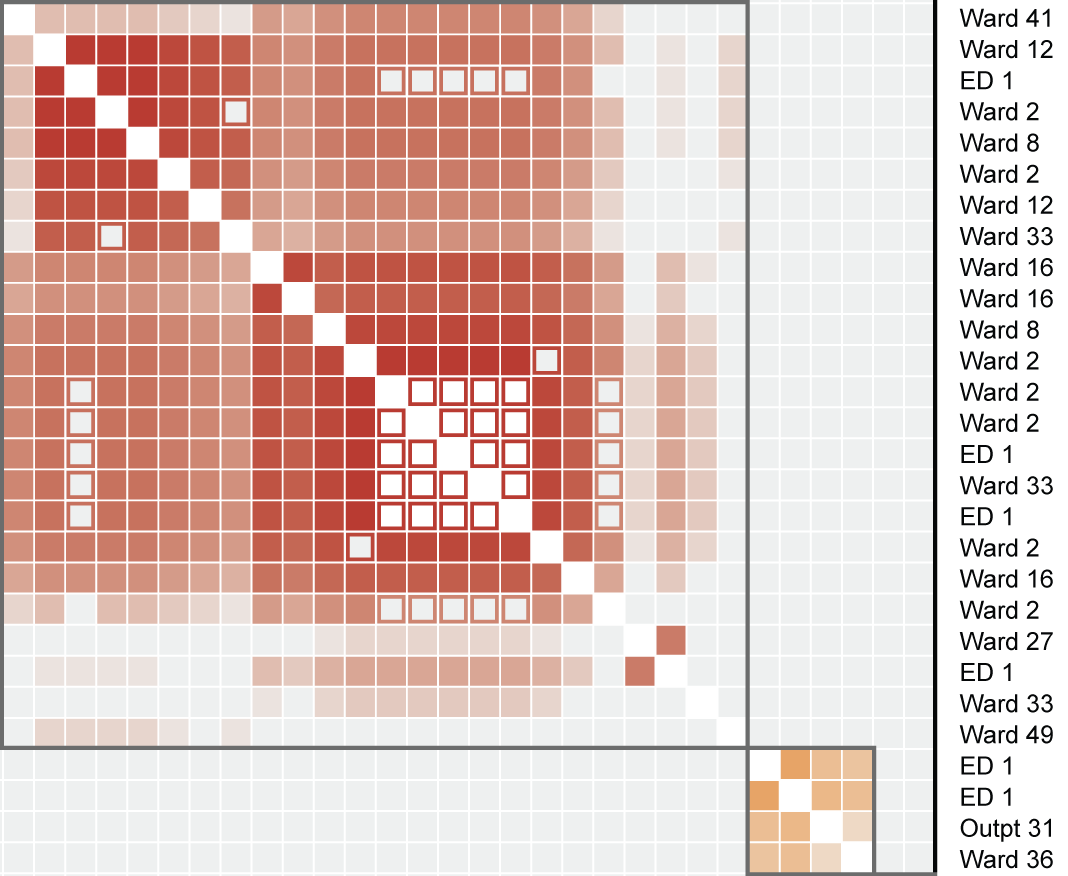
Clustered heatmap of related genomes reveals outbreaks over multiple wards.
Figure 2 in Berbel Caban & Pak, et al.
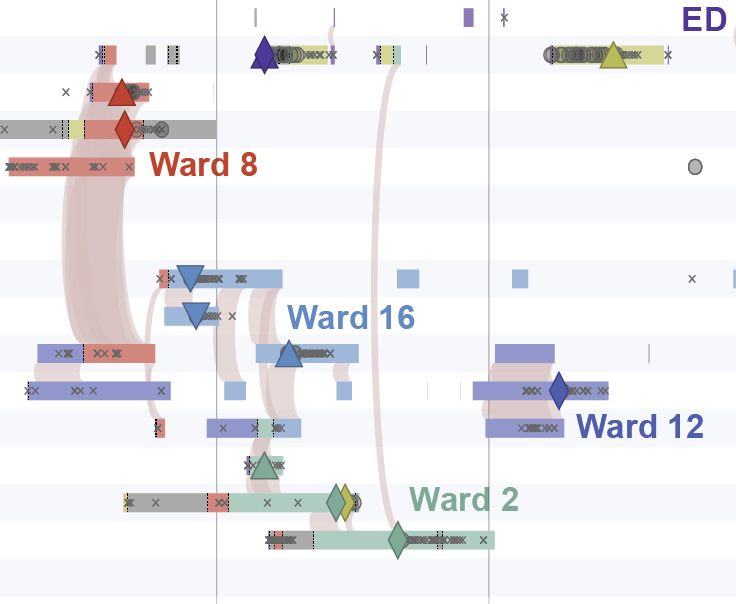
A timeline of spatiotemporal movements and overlaps of patients in the largest cluster.
Figure 3 in Berbel Caban & Pak, et al.
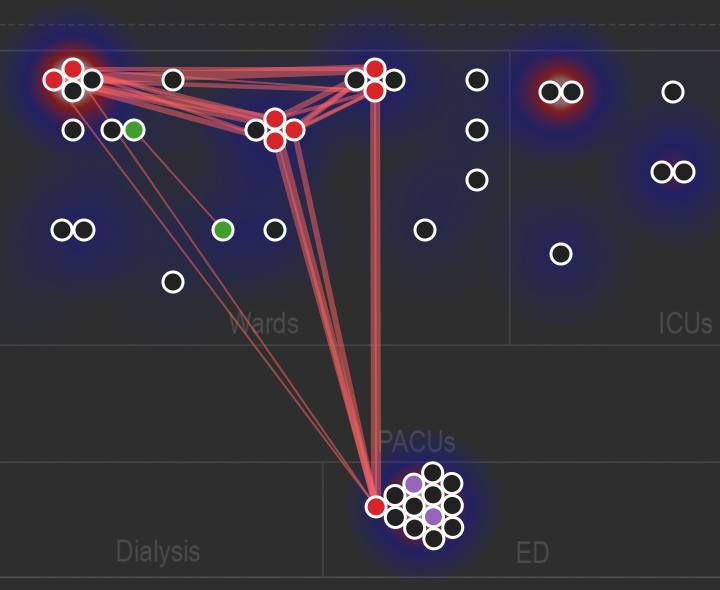
Animated network diagram showing the spatial relationships among related genomes over time.
Figure S1 in Berbel Caban & Pak, et al.
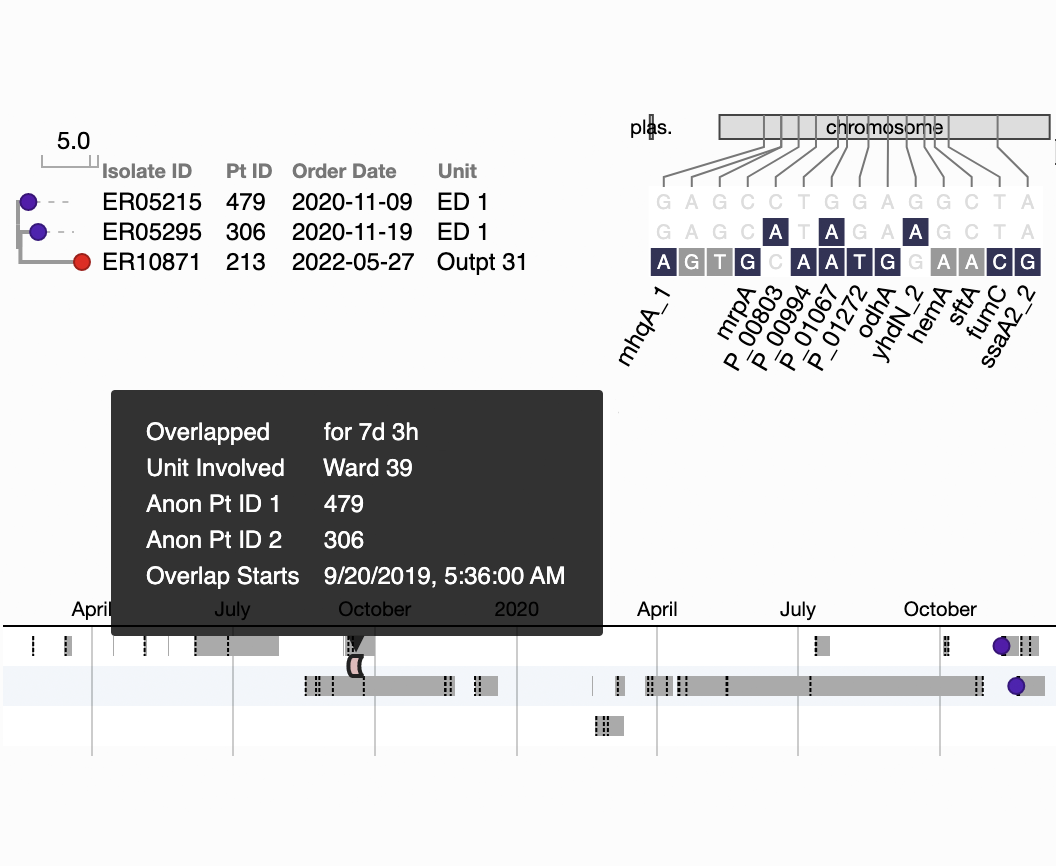
A 7-day overlap in inpatient ward stays precedes a transmission event detected one year later.
Figure S3B in Berbel Caban & Pak, et al.
Interested in viruses? See our influenza A investigation in CID, where pathoSPOT characterized a nosocomial outbreak affecting 66 patients and healthcare workers and identified “patient zero.”
Get Started
You can use pathoSPOT to analyze your own pathogen genomes and create visualizations similar to the ones above. As a tutorial, we will reproduce the analysis in Berbal Caban & Pak et al. starting from the raw data (tar.gz).
This dataset contains FASTA sequences for 226 MRSA genomes, gene annotations in BED format, and a relational database (in SQLite format) with metadata for each genome (anonymized patient IDs, collection locations, healthcare encounters for each patient, and more).
pathoSPOT is designed to run on Linux; however, we provide a Vagrant configuration so that anybody, including Mac and Windows users, can quickly create a virtual machine (VM) that runs the pipeline either on their personal computer or on the Amazon EC2 cloud. We'll use VirtualBox to run the VM locally for this example; you'll need 5GB of disk space and 8GB of RAM.
To get started, install Vagrant and VirtualBox. Then open your terminal program and run the following commands:
$ git clone https://github.com/powerpak/pathospot-compare
Cloning into 'pathospot-compare'...
... More output ...
$ cd pathospot-compare
$ vagrant up
... Much more output ... may want to get some ☕
$ vagrant ssh
If everything worked, you should see vagrant@stretch:/vagrant$ which is a shell running on your brand new Linux VM. The VM has already downloaded the example dataset, which you will find inside /vagrant/example.
By default, the VM is configured to run a full analysis on those data, which you can kick off with:
$ rake all
... More output, takes 1/2 to 2 hours. The last line should be ...
WARN: re-invoking parsnp task since the mash clusters were rebuilt
$
When it's finished, open http://localhost:8989 in your browser. (It will look exactly like this website, except the Try it Now Try it Now section will be replaced by the datasets and analysis produced by your VM.)
How it works
pathoSPOT is made of two components. One runs the comparative genomics analysis, and the other drives the visualization engine.
pathospot-compare

Prefilters FASTA sequences, clusters them by estimating nucleotide identity, and then creates multisequence alignments for each cluster of genomes to calculate SNP distances.
pathospot-visualize

Converts calculated SNP distances and metadata on sample collection and patient movements to produce interactive heatmap and timeline visualizations viewable in a web browser.
Team
pathoSPOT is developed, used, and maintained by the Pathogen Surveillance Program and the Bakel Lab at the Icahn School of Medicine at Mount Sinai.
It currently supports active surveillance of transmissible pathogens in facilities throughout the Mount Sinai Health System.
Contributing developers include: Theodore Pak, Mitchell Sullivan, Harm van Bakel, and Elizabeth Webster. On GitHub, you can also view the list of contributors for each project.
Questions? Please contact Theodore Pak or Harm van Bakel.
Bugs? Please file an issue on our GitHub projects:
How do I cite this? If you use pathoSPOT for your own research, we would appreciate if you reference:
- Berbel Caban A, Pak TR, Obla A et al. PathoSPOT genomic epidemiology reveals under-the-radar nosocomial outbreaks. Genome Med. 2020 Nov 16;12(1):96. PMID:33198787 doi:10.1186/s13073-020-00798-3
The influenza A outbreak investigation can be cited as follows:
- Javaid W, Ehni J, Gonzalez-Reiche AS et al. Real-Time Investigation of a Large Nosocomial Influenza A Outbreak Informed by Genomic Epidemiology. Clin Infect Dis. 2020 Nov 30;ciaa1781. PMID:33252647 doi:10.1093/cid/ciaa1781